
티스토리 뷰
Loki는 Grafana Labs에서 개발한 오픈 소스 로그 집계 시스템으로, Prometheus의 메트릭 수집 방식과 유사하게 설계되어 로그 데이터를 효율적으로 수집하고 저장합니다. 특히 Loki는 메타데이터(레이블)를 기반으로 로그를 필터링하고 검색할 수 있도록 하여 기존의 로그 수집 시스템보다 리소스 소모가 적습니다.
Promtail은 Grafana Loki와 함께 사용되는 로그 수집기입니다. Promtail은 다양한 소스에서 로그를 수집하고, 이러한 로그를 Loki로 전송하여 저장하고 쿼리 할 수 있도록 도와줍니다.
1. Loki, Promtail 설치
https://github.com/grafana/loki/releases- 위 URL로 접속합니다.
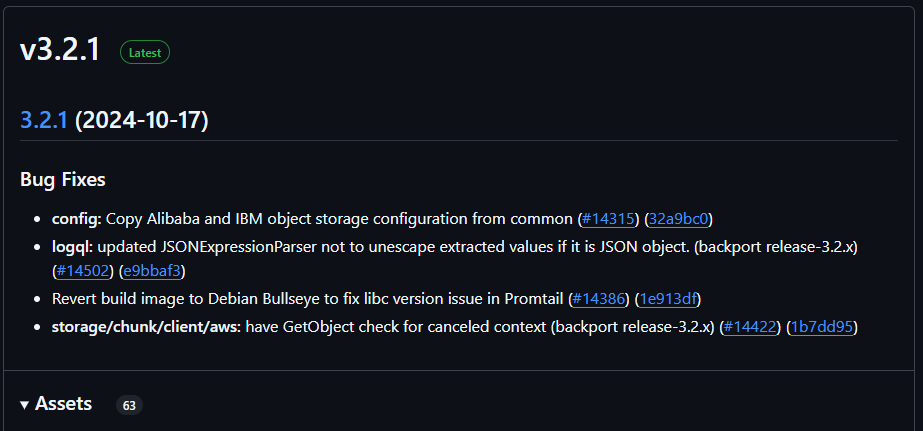


- 최신 버전을 선택한 후, Assets 항목에서 윈도우용 exe 파일을 찾습니다.
- "loki-windows-amd64.exe.zip" 파일과 "promtail-windows-amd64.exe.zip" 파일을 다운로드합니다.
2. 환경설정
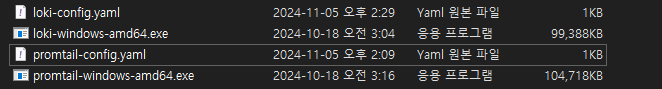
- 다운로드한 파일을 원하는 폴더로 이동시킵니다.(저는 D:\loki\ 경로로 이동시켰습니다.)
- 각 파일의 config.yaml 파일을 생성합니다.
2.1. loki-config.yaml 작성
auth_enabled: false

server:
  http_listen_port: 3100
  grpc_listen_port: 0 	#관리포트 비활성화

ingester:
  lifecycler:
    ring:
      kvstore:
        store: inmemory
      replication_factor: 1

schema_config:
  configs:
    - from: 2020-10-24
      store: boltdb-shipper
      object_store: filesystem
      schema: v11
      index:
        prefix: index_
        period: 24h

storage_config:
  boltdb_shipper:
    active_index_directory: D:/loki/storage/index
    cache_location: D:/loki/storage/index_cache
  filesystem:
    directory: D:/loki/storage/chunks

limits_config:
  allow_structured_metadata: false

compactor:
working_directory: D:/loki/work- 위처럼 config 파일을 작성하고 cmd 창을 열어 아래 명령어로 실행합니다.
loki-windows-amd64.exe --config.file=loki-config.yaml -config.expand-env=true
2.2. promtail-config.yaml
server:
  http_listen_port: 9080

positions:
  filename: D:/loki/conf/positions.yaml

clients:
  - url: http://127.0.0.1:3100/loki/api/v1/push

scrape_configs:
  - job_name: windows_logs
    static_configs:
      - targets:
          - localhost
        labels:
          job: varlogs
__path__: D:/loki/logs/application.log- 마찬가지로 cmd 창을 열고 아래 명령어를 입력합니다.
promtail-windows-amd64.exe --config.file=promtail-config.yaml
3. Grafana 연동
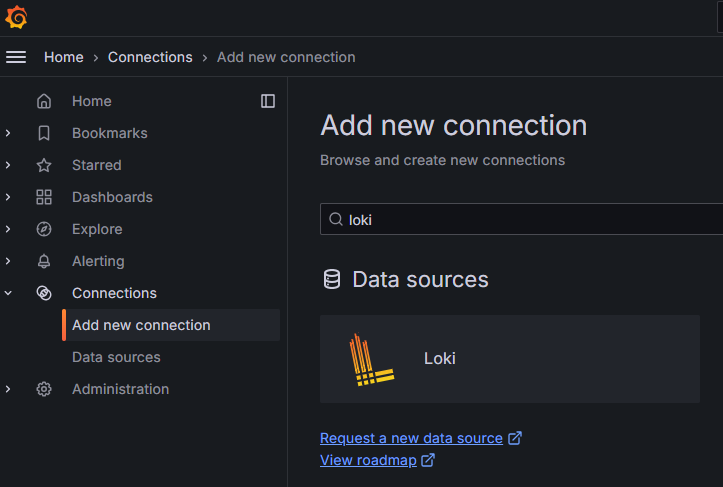
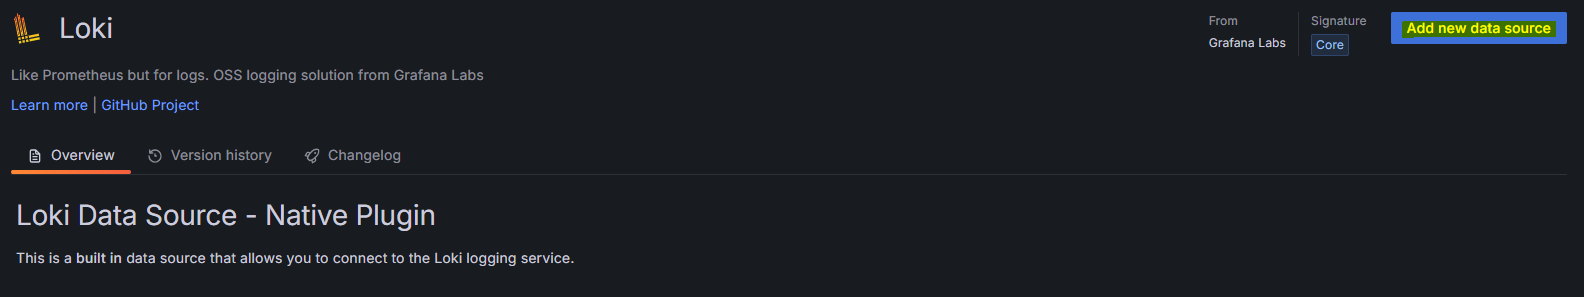
http://localhost:3000/connections/add-new-connection?search=loki- Grafana 서버를 동작시키고 접속합니다. Grafana 설치 및 설정은 포스팅을 참고해 주세요.


- "Build a dashboard" 버튼을 클릭합니다.

- "Add visualization" 버튼을 클릭합니다.
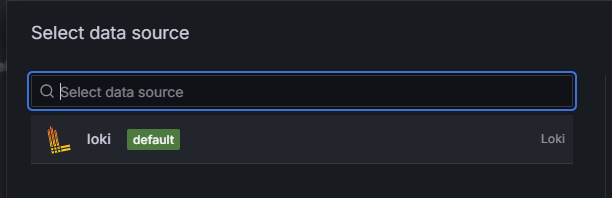
- loki를 선택합니다.
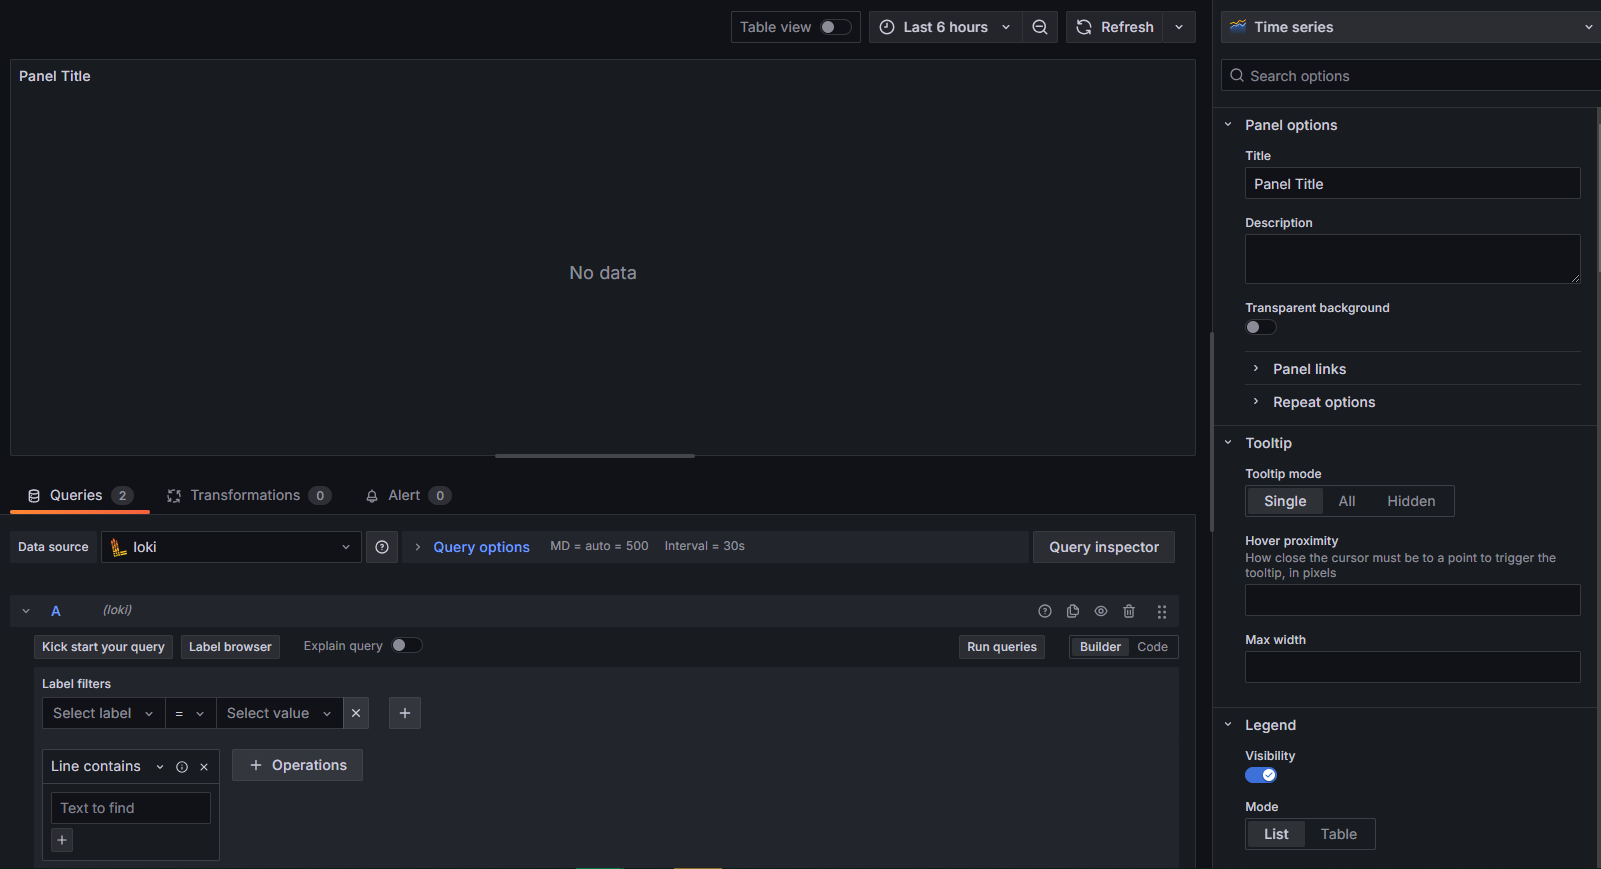


- 쿼리를 작성하시고, "Run query" 버튼을 클릭하시면 대시보드 화면에 로그가 출력됩니다.
감사합니다.
'도구 및 환경 > Tool' 카테고리의 다른 글
| [JIRA] JIRA Cloud Free(클라우드 무료) 사용하는 방법 (0) | 2025.04.03 |
|---|---|
| [Window] Docker Compose 로 Grafana, Loki, Promtail 구성 (3) | 2024.11.06 |
| [Grafana] Window 에 Grafana 설치하기 (2) | 2024.11.05 |
최근에 올라온 글
- Total
- Today
- Yesterday