티스토리 뷰
현대적인 MSA 환경에서는 시스템 상태를 모니터링하고 성능을 시각화하는 것이 필수적입니다. Prometheus와 Grafana는 이러한 요구를 충족시키는 강력한 오픈소스 도구로, Kong API Gateway와의 연동을 통해 효율적인 모니터링 환경을 구축할 수 있습니다. 이 글에서는 Kong을 중심으로 Prometheus와 Grafana를 연동하여 API 트래픽 및 시스템 상태를 한눈에 파악하는 방법을 안내합니다.
1. 프로메테우스 설정
# 디렉터리 구조

prometheus
│  docker-compose.yml
│  prometheus.yml
└─ data/
1.1. docker-compose.yml 작성
version: '3.8'

services:
  prometheus:
    image: prom/prometheus:latest
    container_name: prometheus
    ports:
      - "9090:9090"
    volumes:
      - ./prometheus.yml:/etc/prometheus/prometheus.yml  # Prometheus 설정 파일
      - ./data:/prometheus/data                          # Prometheus 데이터 저장
    networks:
      - my-network

  grafana:
    image: grafana/grafana:latest
    container_name: grafana
    ports:
      - "3000:3000"
    environment:
      - GF_SECURITY_ADMIN_USER=admin				   # admin 초기 ID
      - GF_SECURITY_ADMIN_PASSWORD=admin			   # admin 초기 PW
    volumes:
      - grafana_data:/var/lib/grafana                  # Grafana 데이터 저장
    networks:
      - my-network

networks:
  my-network:
    external: true                                    # 기존 네트워크 재사용

volumes:
grafana_data: # Grafana 데이터 볼륨 정의- Prometheus 와 Grafana 설정을 작성합니다.
1.2. prometheus.yml
global:
  scrape_interval: 15s  # 기본 메트릭 수집 주기

scrape_configs:
  - job_name: 'backend_docker'
    static_configs:
      - targets:
          - 'my-kong:8001'  # Kong Admin API 메트릭 엔드포인트

  - job_name: 'node'
    static_configs:
      - targets:
- 'node-exporter:9100' # Node Exporter 기본 포트- API Gateway 로 Kong 을 사용하였고, CPU/RAM 사용량을 확인하기 위해 node-exporter 설정을 작성합니다.
1.3. node-exporter 실행
docker run -d -p 9100:9100 --name=node-exporter prom/node-exporter:latest
docker network connect my-network node-exporter- node-exporter 를 실행시키고 my-network 에 수동으로 연결합니다.
1.4. 실행
docker-compose up -d- docker-compose.yml 파일이 있는 디렉터리로 이동하여 명령어를 실행합니다.
1.5. 실행 확인

- Docker desktop 을 통해 정상 동작을 확인합니다.
http://localhost:9090/targets
- Prometheus 페이지로 접근하여 State 가 "UP" 인지 확인합니다.

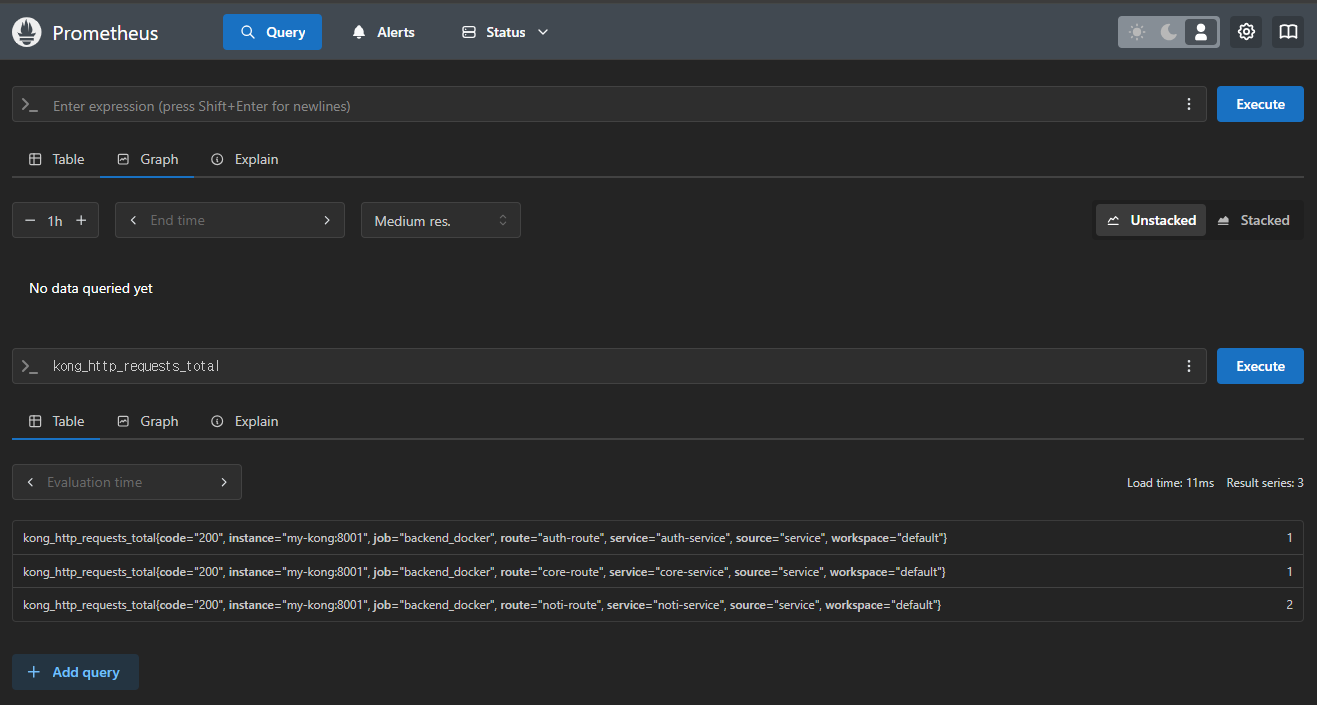
- Query -> Graph 탭으로 이동하여, "kong_http_request_total" 의 입력결과 출력되는지 확인합니다.
2. Grafana 설정
2.1. 어드민 페이지 접근
http://localhost:3000/login
- Grafana Admin 페이지에 접속합니다.
- 설정파일의 'GF_SECURITY_ADMIN_USER', 'GF_SECURITY_ADMIN_PASSWORD' 가 초기 ID/PW 입니다.
2.2. 대시보드 템플릿 설치
https://grafana.com/grafana/dashboards/1860-node-exporter-full/
- 위 사이트에 접속 후, "Download JSON" 버튼을 클릭하여 대시보드 템플릿을 사용할 수 있습니다.
2.3. Data source 연결

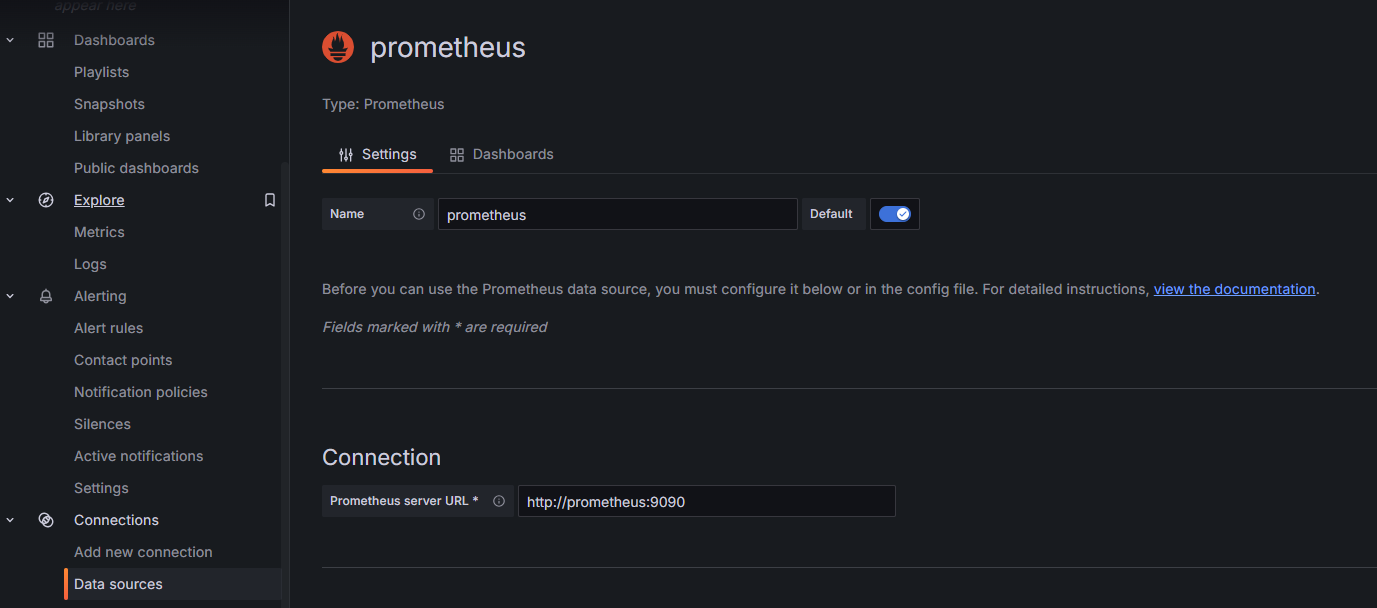
- prometheus Data sources 를 추가합니다.
2.4. 대시보드 연동

- 우측 상단 "+ > Import dashboard" 를 클릭하고 다운로드한 json 파일을 옮깁니다.
- 저는 이미 사용 중이라 분홍색 경고창이 뜨는 상태입니다.
2.5. 실행 확인

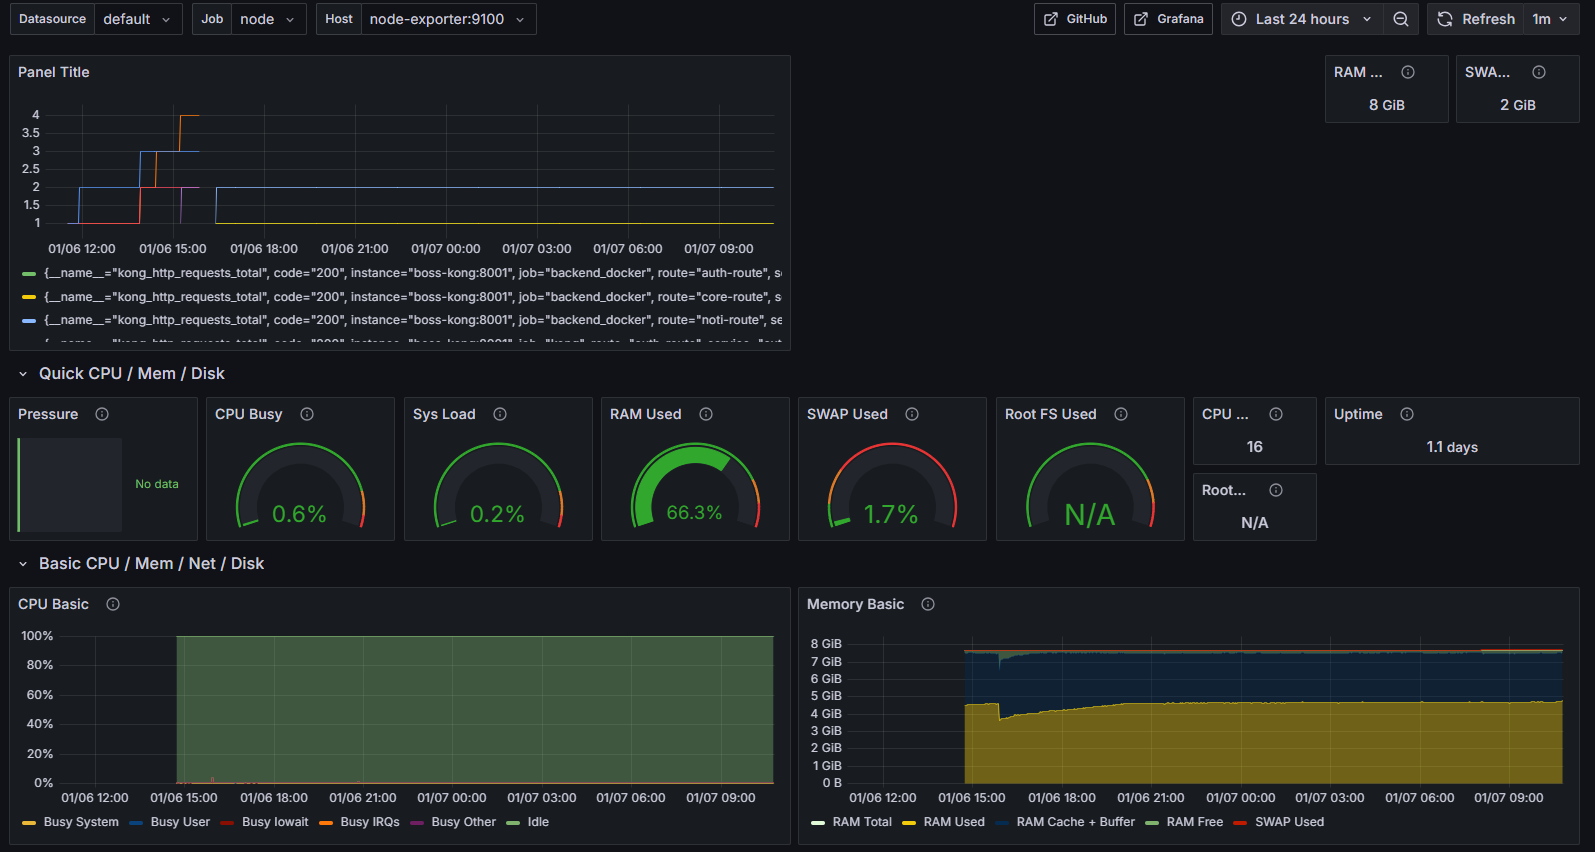
- 이후, 원하는 패널 추가 및 자리 배치를 통해 모니터링을 할 수 있습니다.
감사합니다.
최근에 올라온 글
- Total
- Today
- Yesterday
